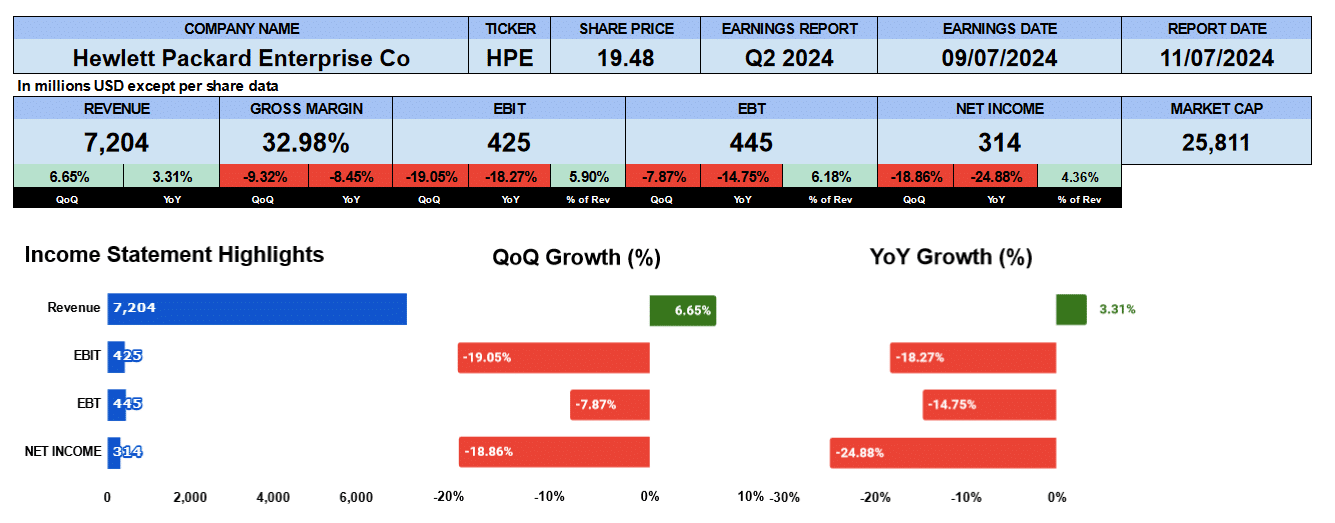
Hewlett Packard Enterprises reported second quarter earnings June 4th. Earnings topped forecasts and beat guidance on, you guessed it, AI driven revenue. Revenue was up sequentially and year over year but all the other line items were down. Overlooking that, the market was happy sending the shares up over 10%.
Hewlett reported revenue of $7.2 billion up 7% quarter over quarter and 3% year over year. Gross margins, however, we’re down by 9% coming in at 33%. Operating profit was $425 million down 19%, which is about 6% of revenue. Net income was $314 million also down 19% and 25%, respectively. That’s just over 4% of revenue. Not exactly numbers that would get you excited.
HPE Quarterly Revenue

Looking to the quarterly income statement bar chart we can see that revenue has basically been flat up just 79 basis points since Q2 2022. Profit has grown by just 1%, operating profit fared better up by 8.3% and net income increased 2.6%. These are quarterly compounded growth rates.
HPE Segment Revenue

Looking at the segment revenue. Their server segment which is their biggest business shown in blue reported $3.9 billion in sales or about 53% of revenue. But that has been shrinking by 60 basis points since Q2 2022. It’s this segment that has the market buzzing up over 17% year over year. Their hybrid cloud business, however, their second biggest segment in red, posted $1.26 billion or 17.1% of revenue growing by 6.5%. Intelligent Edge earned just over $1 billion or 15% of revenue and it’s been growing about 2.5%. Their financial service business is about by 58 basis points finishing the quarter at $867 million or about 11.8% of revenue.
HPE Inventory Turnover

We noticed that inventories have been growing and also their accounts payable. So we thought we would take a look at their working capital. Days payable outstanding has jumped to 188 days or more more than 6 months. That’s how long it takes suppliers to get their payment. Also, their day’s inventory outstanding has jumped quite a bit from Q4 2023 to 137 days. The growth in inventory is going to need to be sold at reduced prices and or written down. Days sale outstanding, however, remained basically flat to 48 days. This is how long it takes them to sell their products to a customer. We think that the excess inventory levels are going to hurt in the coming quarters.
HPE Fundamental Valuations

Okay. Let’s look at the valuations. Shares outstanding actually grew by 9 million shares this quarter. Earnings per share was $0.24 down 19.4% and 25%, respectively. Sales per share was $5.40 up by 6% sequentially and 3% year over year. Cash per share was down to $2 per share or 30% quarter over quarter and 4% year over year. Book value was improved on yearly basis to $16.40. The current PE of Hewlett is 20.55 and the S&P500 PE is 27.72. Hewlett’s peg ratio is negative 2.17 as net income growth has been negative. Looking at the leverage ratios debt ratio is only 0.13, debt to equity, 0.34 and 19 times Interest coverage is good. The liquidity ratios have the current ratio at 0.9, Quick ratio 0.27 and cash at 0.11. Not too bad.
Return on assets was only 2.1% and return on equity is only 5.8%. Not impressive. Return on capital employed was 5.4%. Return on invested capital was just over 5%. Hewlett’s effective tax rate is 10.2% giving us a NOPAT of $1.7 billion and their average debt and equity is $33.7 billion.
Cash flow numbers are decent but not growing. Operating cash flow was $1.1. billion. Investing outflows were $1.1 billion and financing outflows $1.7 billion giving us free cash flow to the firm of nearly $3 billion slightly lower year over year over year. It’s a good but we like to see it growing.
Hewlett pays a dividend of $0.13, yielding 2.6%, growing at 8.5%. This is a payout ratio of 53.8%. The firms enterprise value is 30.6 billion. That is just 1 times multiple to revenue suggesting Hewlett is undervalued. 3.2 times multiple to EBITDA and 10.5 times free cash flow.
HPE Guidance

The company provided guidance for next quarter and for the full year. They said next quarter’s revenue would be between $7.4 and $7.8 billion and earnings of 29 to 34 cents. Their full year EPS is expected to be between $1.61 to $1.71 so we used $1.66 to get a forward PE of 12. Dell’s forward PE is 20. If Hewlett’s PE was 20 it would be trading at $33.
HPE Rating

Key takaways from the report is that server revenue is growing as Hewlett participates in the AI industry. Free cash flow while not growing is still good. The dividend is always nice. We like the forward PE at 12 and the enterprise value to revenue multiple which suggests there’s more upside for Hewlett Packard. On the con side the gross margin contracting by 2% doesn’t help. The excessive inventory levels imply that Hewlett will need to cut prices to get rid of its inventory. We see that the cash is decreasing while it is not a red flag it’s still something to watch. That being said, we have a mixed view of Hewlett giving it a neutral to a cautious buy rating. We have no exposure to this company

