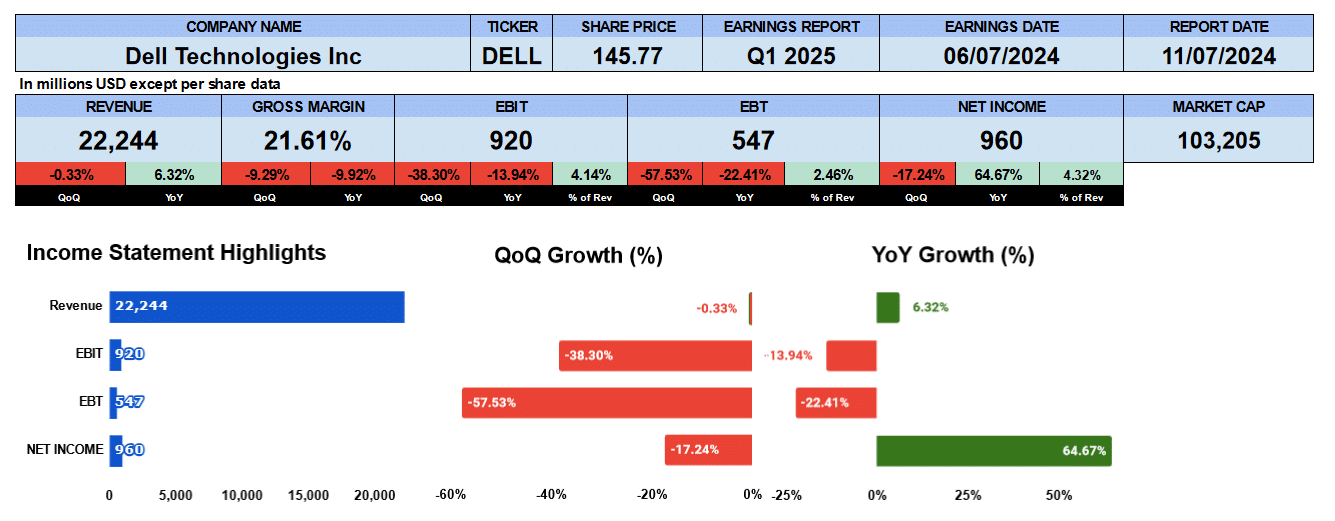
Dell reported their first quarter 2025 earnings on May 30. While they did beat earnings it was their guidance and lower margins which saw shareholders pound the stock lower by 18%. CNBC said revenues were expected to be $21.6 billion with and an EPS of $1.26.
Dell’s revenue for the quarter was $22.2 billion up 6.3% year over year and lower by 33 basis points, sequentially. Gross margins were 21.6% down 9% quarter over quarter, and 10% year over year. This is where the market was concerned. Operating profit was $920 million down 38% quarter over quarter and 14% year over year, which is about 4.1% of total revenue. Net income was $960 million down 17% quarter over quarter, but up 65% year over year. We can see pretax profit of $547 mill which tells us Dell had a tax gain of over $400 million and without that $400 million their year over year net income would have been lower. That tax credit saved them.
If you are interested, our Full year 2024 report on Dell is linked below.
Dell Quarterly Revenue

The 9 quarter income statement bar chart shows that those revenue have been trending lower. Net revenue has contracted by 1.7% since Q1 2023. Gross profit has also been lower by 2%. Operating profit down 5.6% and their net income also lower by 1.2%. All is not rosy at Dell. It’s worth noting that the comparable quarter was Dell’s worst in quite sometime at $20.9 billion giving a perceived improvement of the line items.
Dell ISG Revenue

Turning to the segment breakdown their Internet service group shows that servers and networking, in blue, grew by 89 basis points in the last nine quarters to report almost $5.5 billion in revenue. This is up 12.5% from the previous quarter and 42% year over year as customers were buying AI-optimized servers . Their storage business, shown in red, earned $3.8 billion but it has been contracting by 1.3% making up 41% of revenue down from 45.6%. in Q1 2023. The Yellow line is their operating income and we can see here it has been rather volatile over the 9 quarters finishing Q1 2025 at $736 million or 8% of segment revenue growing by -4.2%
Dell CSG Revenue

The client service group hasn’t fared much better. In blue, the commercial business is lower by 1.8% reporting $10.2 billion or 85% of revenue with their consumer business contracting by 7.4% earning $1.8 billion down from $3.6 billion in Q1 2023. The PC market continues to struggle. Operating income for CSG was less by 4.6% over the 9 quarters to $732 million which is a 6% margin.
Dell Fundamental Analysis

Let’s look at some ratios. Shares outstanding we’re down by two million on a fully diluted basis, giving us an EPS of $1.36 up 68% year over year. But keep in mind that the comparative quarter was its worst in several quarters and they also earned $400 million tax credit this period. Without that tax credit earnings per share would be much lower. Sales per share was $31.40 up 8.7% year over year. Cash per share was $8.23, both lower quarterly and year over year. Dell has a negative shareholder equity so book value is negative $3.85. Dell is owned by the banks and not the shareholders. PE is 24.34, annualizing EPS of $1.36 where the S&P500 has a PE of 27.5. Dell has a PEG ratio of 1.17.
Looking to the leverage ratios, the debt ratio is 0.24 and debt to equity is negative 7, again, because shareholder equity at Dell is negative. Interest coverage is only 2.5. The liquidity ratios have a current ratio at 0.7, quick of 0.3 and cash at 0.12. Short-term liquidity need some improvement. Return on assets was 4.8%. Return on capital employed was 15.6% and return on invested capital is 13.1%. Dell’s effective tax rate is 4.2% but that is distorted given the tax credit. This gives us a NOPAT of $4.8 billion with their average debt and equity of $37 billion.
Cash flows were worse though still reasonable. Operating cash flow was $1 billion lower year over year by 41%. Investing outflows were $456 million primarily from capital expenditure. Financing outflows were $2 billion from servicing debt but share repurchases were accelerated to $700 million. Free cash flow of the firm of nearly $6 billion, down 25% year over year.
Dell pays a dividend of $0.47, yielding 1.4% which is growing at a 25% rate. This is a payout ratio of 35%. The enterprise value of Dell is $107 billion which is a 1.2 times multiple to revenue, 5.6 times to EBITDA and 18 times to free cash flow.
Dell’s Guidance

The company provided guidance for Q2 2025. They’re expecting revenue of $23.5 to $24.5 billion dollars. They’re operating expenses should improve according to the guidance and they are expecting an EPS between $1.55 and $1.75. Using $1.65 as our earnings per share we get a forward PE of 20.
Dell’s Rating

Key takeaways from the report on the pro side is the growth in server revenue as customers are embracing AI. Free cash flow though lower was still good. The dividend is always nice. The enterprise value multiples suggest Dell is undervalued. On the con side the gross margins were down quite a bit. Dell has a lot of debt and is owned by the banks. Results were better than they actually were due to the tax credit. We’ll be watching margins next quarter and sever growth in Q2 but for now we give Dell a neutral rating.
We have no exposure to this company.

