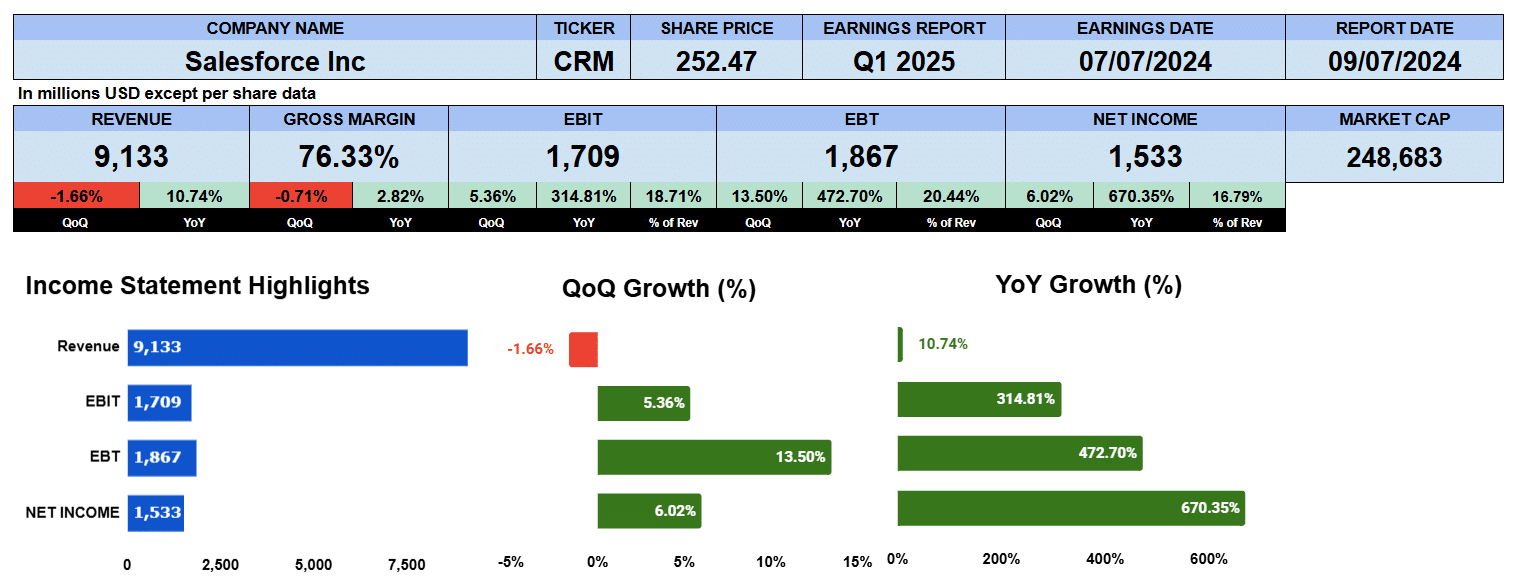
Salesforce reported Q1 2025 earnings on May 29th. The market was expecting $2.37 per share but fell short reporting $1.56, even though revenue missed by only $20 million. Company guidance was lower than expected and the markets reacted selling the enterprise software firm down 20%. Their COO said Salesforce was experiencing “elongated deal cycles, deal compression and high levels of budget scrutiny.” but our valuations suggest the company was a little over-valued.
Revenue was $9.1 billion up 10.7% year over year and slightly lower quarter on quarter. Gross margins were an impressive 76.3% improved by 2.8% from Q1 2024 but down 71 basis points sequentially. Operating profit was $1.7 billion jumping 315% year over year, and 5% quarter on quarter giving an operating margin of 18.7%. Net income was $1.5 billion improved 670% year over year and 6% sequentially equating to 17% of revenue.
Salesforce Quarterly Revenue

Looking at the 9 quarter income statement bar chart, we can see that revenue has been growing at a compound quarterly growth rate of 2.4%. Gross profits by almost 3%, operating profit at 64% and net income by 56%. But if we take only the last four quarters, growth has been more muted though expanding. We see that revenue is up 1.5%, gross profits by 1.8%, Operating profits 3.7% and net income by 5%. This is probably more indicative of their growth going forward.
Salesforce Segment Revenue

Revenue by segment shows Sales, in blue, has been growing by 2.3% on a quarterly compound basis reporting nearly $2 billion or 23.3% of revenue. Services, in red, have been growing at a 2.4% clip. That segment reported $2.2 billion or 25.4% of revenue. Their platform business in yellow has being growing by 2.2% and they earned $1.7 billion or about 20% of revenue. Marketing and communications was better by 1.8% over the nine quarters reporting $1.3 billion or nearly 15% of revenue and integration and analytics, their best performing segment in orange expanded by 4.4% where they finished the quarter at $1.4 billion or 16.4% of sales.
Salesforce Revenue by Geography

Looking at revenue by geography, the Americas is the number one market with which sales force does business. It reported just over $6 billion to two thirds of total revenue. It’s been growing at a 2.2% rate. Europe, shown in red, has been growing at 2.4%. They reported $2.15 billion or 23.5% of revenue. And lastly, APAC in yellow has been growing by over 3% earning $926 million last quarter or 10.1 percent of revenue.
Salesforce Fundamental Valuations

Let’s look at some ratios. As we said, earnings per share wa s $1.56 up 672% year over year and 5.8% sequentially. Sales per share are $9.30 better by 11% year over year but slightly lower from last quarter. Cash per share is $10.11 better both quarterly and year over year. Book value at $60.59 was improved to 4% year over year and basically flat from last quarter. Salesforce has a PE 35 where the SP 500 is 27.21 suggesting perhaps Salesforce is overvalued and this PE is using the closing price after the sell-off. The PEG ratio at 7.14 suggests earnings growth isn’t keeping up with the PE. Looking at the leverage ratios the debt ratio of only 0.09. Salesforce has almost a $100 billion in assets. Debt to equity of just 0.14. The liquidity ratios are good as well. The current ratio is 1.11, the quick ratio 0.95 and the cash ratio is 0.43. Plenty of short term liquidity. Return on assets were just 6.4% but bear in mind assets are $100 billion. Return on equity of 10.3% gives us an equity multiplier of 1.61. Return on capital employed was 8.6%, return on invested capital was 7.8%. Salesforce has an effective tax rate of 15.7% giving us a NOPAT of $5.3 billion and has an average debt and equity of $68.3 billion. Salesforce has some great cash flow numbers too. Operating cash flow was $6.2 billion up 39%, investing outflows were $2.6 billion and financing outflows were $2.1 billion giving them a free cash flow to the firm of almost $10 billion up 9% year over year. Salesforce finally paid its first dividend of $0.39 yielding 0.72%, giving a payout ratio of 25%. The enterprise value of Salesforce is $213 billion which is a 5.8 multiple to revenue, a 7.7 multiple to EBITDA and 21 multiple to free cash flow.
Salesforce Guidance

The company provided guidance which the analyst community were not too impressed. Q2 revenue is expected to be between $9.2 and $9.25 billion. Operating margin for the full year to be 19.9%. So we used that in our guidance bar chart. EPS was guided as $1.31 to $1.33 and their full year EPS is expected to be $6.04 to $6.12. Based on the full year EPS of $6.07 gives us a forward PE of 35.8. If Salesforce had a PE of 25 it would be trading at $152.20.
Salesforce Rating

Key takeaways. 76% gross margins at Salesforce you don’t find every day are very impressive. Free cash flow of $10 billion is very good. The firm’s finally paying a dividend. Salesforce has a strong balance sheet and is a well capitalized company. On the con side the guidance was softer than expected. The PE and the PEG ratio indicate the stock is overpriced even after the sell off. Salesforce’s overall growth seems to be slowing that being said we’re giving the firm a rating of neutral.
We have no exposure to this company.

