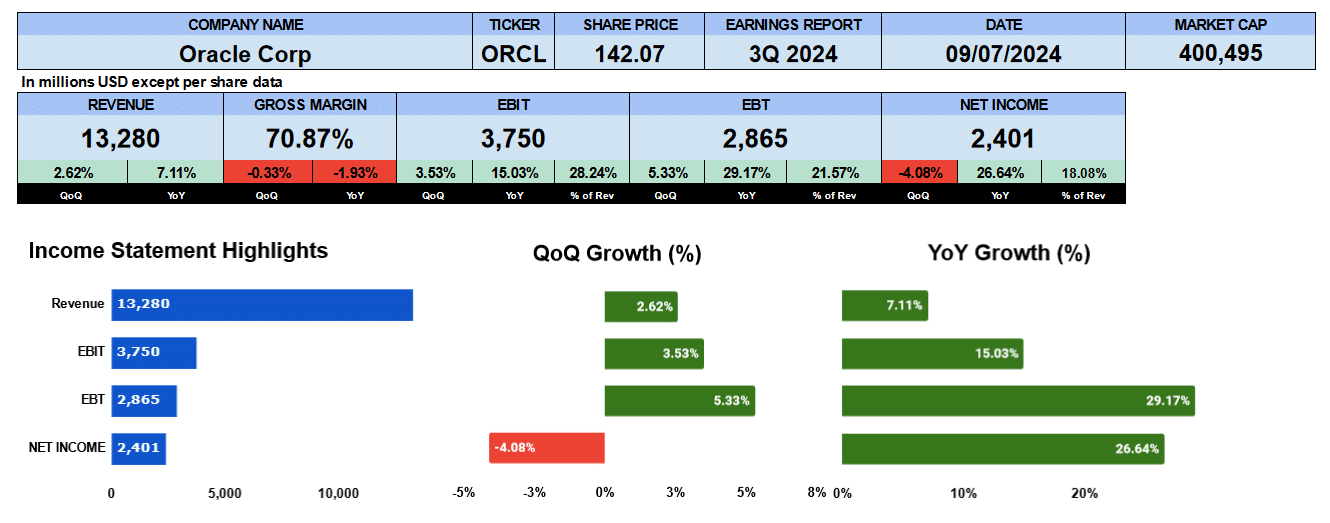
Big gross margins and an even larger debt define Oracles recent earnings report. Oracle reported their Q3 2024 on March 11th and the results were well received by the market pushing the stock to an all time high.
Revenue for the quarter was $13.3 billion up 2.6% quarter over quarter and 7% year over year. Gross margins were slightly softer, down to 70.9%. In fact, margins have been decreasing from a high of 79.8% in Q2 2022 when Oracle bought Cerner, a US-based supplier of health information technology for $28 billion.
Operating profit was $3.75 billion up quarter over quarter by 3.5% and 15% year over year. Operating profit makes up about 28% of revenue. Net income was down 4% quarter over quarter due to higher tax provisions, but up 26% year over year, representing about 18% of revenue.
Oracle Quarterly Revenue

Turning to our quarterly revenue graph. we can see that revenue has been growing at a 2.6% compound quarterly basis. We can see here in Q4 2022 when Oracle bought Cerner revenue dipped slightly but has been growing ever since to a peak of $13.8 billion in Q4 2023. Gross profits have been growing at a 1.4% level while operating profit and net income have largely been flat.
Oracle Business Segment Revenue

Revenue by business segment, we can clearly see here the Cloud service business in blue has been growing steadily from a low of $2.8 billion in Q3 2022 to a high of just over $5 billion in Q3 2024 growing at 6.8%. Their license support business has largely been flat, seen here in red and ending the quarter at $4.9 billion. Cloud license and online premises revenue has been slightly lower ending the quarter at $1.2 billion here in yellow. Also, the hardware business has been drifting lower growing on a quarterly basis of negative 0.6% to finish at $754 million their smallest business line. Finally, Services has been growing at a 5.8% basis rounding out the quarter at $1.3 billion.
Revenue by geography shows that the Americas continues to be Oracle’s largest customer. Revenue has been growing on a quarterly basis at about 4% reporting $8.3 billion this quarter. Europe has also been growing though at just one percent, to produce $3.3 billion in revenue and finally the Asia Pacific region has been stagnant generating $1.7 billion.
Oracle Fundamental Valuations

If we turn to our ratios now Oracle’s shares outstanding did increase by 1.6% year over year, though the company spent $1 billion on share buybacks in Q3. Earnings per share were 85 cents, slightly down quarter over quarter, but up 25% year over year Sales per share improved to $4.70 slightly better Cache per share came in at $3.36 15% on the quarter, and 13.5% on the year.
Book value is $2.19 growing by 41% from Q2. A year ago, shareholder equity was negative $1.9 billion but now stands at $6.2 billion. So the year over year data won’t be meaningful given that shareholder equity was negative. Oracle’s PE stands at 37.5 compared to the S&P500 at 28.1. PE growth is 1.52. Oracle has about $88 billion in short-term and long-term debt, and that is reflected in the leverage ratios. We can see the debt ratio is 0.6 and debt to equity is a jaw dropping 13.3. The company is using leverage to run the business. A lot. Interest coverage stands at 4.3 with quarterly interest payments running around $800 million plus for the last several quarters. Liquidity ratios, the current ratio is 0.85, quick ratio 0.69 and cash and 0.38. Not too bad given the levels of short-term debt Oracle is carrying.
The equity multiplier for Oracle is 22.2 really underscores their leverage and risk. Return on assets of 7% is up 22% year over year. Return on equity not meaningful given that the comparable quarter had negative equity. Return on capital employed is 3.3% and return on invested capital is 2.6%. Oracle is not a capital intensive company but interesting data all the same.
Looking at the cash flow operating cash flow was $12.6 billion with stock-based compensation at nearly $3 billion. Investing outflows were 4.6 billion almost entirely from capital expenditures. Financing outflows were 8.3 billion due to share buybacks, dividends and debt repayment. Free cash flow left to the firm was $9.5 billion at the end of Q3. Despite all the debt Oracle does pay a dividend of $0.39 which is a yield of 1.2% and it has been growing at 25%. Oracle is paying out 46%. of its income to shareholders. That’s pretty good. The enterprise value of Oracle is $360 billion. In terms of the valuations to revenue that’s 6.8 times, 9.6 times to EBITDA and 9.5 times to free cash flow.
Oracle Rating

We weren’t able to find any guidance for the coming quarter at the time of this report so we’ll just jump to the key takeaways. On the pro side, Oracle does have good cash and good cash flow. We see that the cloud business has been growing very well in the last eight quarters and, despite all the debt, the company is still paying dividends. On the con side though debt is the thing that concerns us the most. It’s not a small amount and makes the firm susceptible to interest rate fluctuations. Gross margins have been slightly compressing since their purchase of Cerner though still good at 70%. The PE ratio compared to the S&P500 indicates the company’s overvalued. Based on that we’re giving Oracle a neutral rating. We think there are other companies with less risk and similar valuations and growth. We have no exposure to this company.

