Featured News
Energy
Technolgy
Palo Alto Networks Beat Earnings Expectation but Cash Flow Multiples Suggest Shares are Fully Priced
Palo Alto Networks, the cybersecurity firm, reported better than expected earnings and revenue on August 19. These were adjusted earnings as the company had a large tax provision in their favour which makes year over year growth look exceptionally large. Guidance for Q1 2025 was also better. The market was happy sending the share price up over 7%.
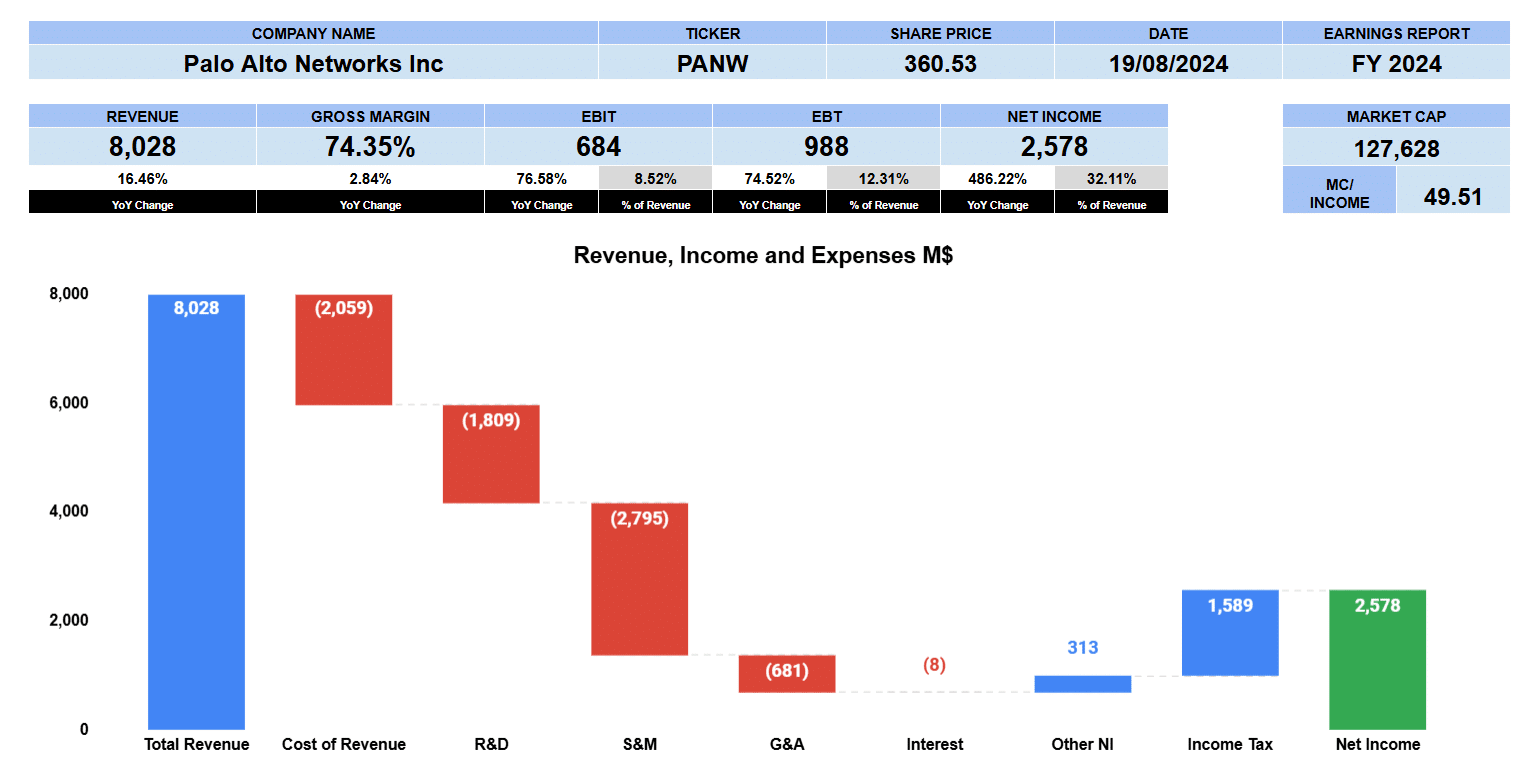
Full year revenue for Palo Alto was $8 billion up 16.5% year over year. Their gross margins also improved 2.8% coming in at 74.4%. Operating profit was $684 million up 77% giving us a margin of 8.5%. Net Income, primarily from a $2 billion tax credit was almost $2.6 billion or a 32% margin. Palo Alto’s market cap is around $130 billion which is about 50 times income.
The waterfall graph for Palo Alto shows where the costs and gains affected the bottom line. Cost of revenue was just over $2 billion. Research and developments was $1.8 billion. Sales and marketing is their biggest cost at $2.8 billion. General and administrative was $681 million. There was a small interest expense. Other income was $313 million. Income tax received was $1.6 billion pushing the bottom line up to $2.6 billion.
Palo Alto Networks Segment Data

Palo Alto segment data for the last five years shows us where the company growth has been the strongest. Its subscription revenue, in red, reported $4.2 billion up 24% in the last 5 years from $1.4 billion and 18% in the last 3 years. Support revenue in yellow is the second largest segment earnings $2.2 billion up 19% over the last five years and nearly 12% since 2022. Product revenue reported $1.6 billion up just 1.6% from last year growing 8.5% since 2020 and 5.6% since 2022.
Palo Alto Networks Fundamental Valuations

Let’s look at some fundamental valuations for Palo Alto Networks. Shares outstanding grew by 3.4%. GAAP earnings per share fully diluted were $7.28 up almost 500% but bear in mind the bottom line is inflated from that tax provision. This gives us a trailing PE of 50.6 compared to the S&P 500 at 29.24. The PEG ratio at 10.8 has earnings growth distorted. Sales per share was up 12.5% to $22.68 giving us 16 multiple of price. Book value grew quite alot year over year to $14.60. Price to book value is 25 times. Cash per share is $4.34 and cash plus marketable securities is $7.28 per share giving us a price multiple between 85 and 50.
The leverage ratios show debt ratio at just 0.05 and debt to equity of 0.19. Interest coverage is 82 times. Liquidity ratios show current at 0.89, quick ratio at 0.68 and cash at 0.34.
Palo Alto had a return on assets of 13% and return on equity of 50%. Return on capital employed is 5.6%. The effective tax rate was not realistic but if we look at their presentation they provided 22%. NOPAT is $533 million with debt and equity of $6.1 billion.
Let’s look at the cash flows. Operating cash flow was almost $3.3 billion. Depreciation and amortization was $283 million and stock based compensation of nearly $1.1 billion. Investing outflows were $1.5 billion with 156 million on PP&E. Financing outflows were $1.3 billion. Palo Alto spent $566 million on share buybacks. Free cash flow to the firm was up 18% to $3.1 billion. Price to cash flow is 42 times, Free cash flow yield is 2.4% and free cash flow margin is 38.6%. We think free cash flow is the best way to evaluate Palo Alto Networks and these valuations seem a little on the high side.
Palo Alto pays no dividend.
Their enterprise value is $128 billion or a 16 multiple to revenue, 133 times to EBITDA, 188 multiple of EBIT and 41.5 times free cash flow. We think these valuations are rather high.
Palo Alto Networks Guidance

Palo Alto Networks provided first quarter and full year guidance. They are expecting full year 2025 revenue to be $9.13 billion or up 13.5% year over year. Operating margin of 27.8% where it is just 8.5% in this report. Earnings per share are non-GAAP of $6.25 which gives us a forward PE of 59.
Palo Alto Networks Rating

Key takeaways from the report are the growing annual recurring revenue Palo Alto has on the books. The improved gross margins up 3%. They have lots of cash and are accelerating their share buyback next year.
The tax benefit they received might drive in buying from uniformed investors who look simply at the headlines. We think the Free cash flow and enterprise value multiples for Palo Alto are a little on the high side fully pricing in future growth and earnings.
We are giving Palo Alto Networks a neutral to a cautious buy rating. We have no exposure to this company.
Automotive
Restructuring Charge Hits Tesla’s Bottom Line But Other Segments Making Money
Tesla’s second quarter earnings were announced after the close on July 23rd. A restructuring charge, higher research and administrative costs made the bottom line appear worse than it seems. Other segments in the Tesla ecosystem are starting to take up more slack and add to the overall business.
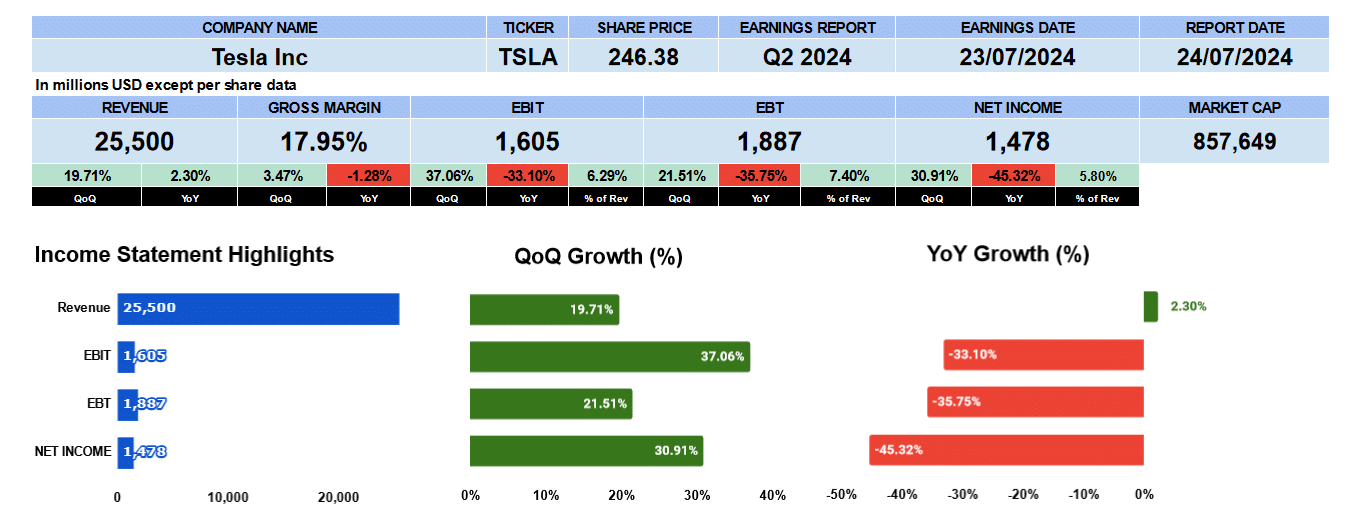
Revenue was $25.5 billion up 19% sequentially and 2% year over year. Gross margin was 18% up sequentially but slightly lower from Q2 2023. Operating profit, where the R&D and restructuring charge are recorded was $1.6 billion up 37% from last quarter but down 33% from last year. The bottom line was nearly $1.5 billion up 31% sequentially but down 45% year over year.
Tesla Quarterly Revenue

The nine quarter income statement bar chart shows the top line has been growing by 4.7% as well as gross profits by 87 basis points. Operating profit is down 4.7% since Q2 2022 and net income by 4.6%.
Tesla Vehicle Production

Lets look at electric vehicle production. The Model 3/Y saw almost 387 thousand new units in Q2 down 6.3% quarterly and 16% year over year though overall growth has been 5.3%. Their other models in contrast have been adding 15.5% from last quarter, 24.5% year over year and up 4.5% overall. Total production was 24,255 units.
Operating lease vehicles were slightly lower to 171 thousand cars down 1% from Q1. Year over year was up 2% and nine quarter growth by 3%.
Tesla Energy Storage and Revenue

Storage deployed is one of the other operations producing a profit for Tesla. Total deployed storage jumped to 9,400 megawatts this quarter. Better by 130% sequentially, 157% from Q2 2023 and growing 26.5% overall. The line in red is the revenue from that business at $3 billion growing 15% from Q2 2022. It comprises almost 12% of total Tesla revenue.
Tesla locations in blue continues its steady growth to 1,286. Improved by 2% from Q1 2024, 20% from last year and 5% overall. The mobile service fleet dropped by 1 to 1,896 down the last 2 quarters.
Tesla Supercharger Stations and Connectors

Supercharger stations, the red line, continues its growth to 6,473. Connectors have a similar growth pattern up to 59,596. Each are growing by around 5.6 to 5.7%
Tesla Fundamental Valuations

Let’s look at some fundamental valuations. Earnings per share was $0.42 better sequentially but lower from last year. Without the $622 million restructuring charge adjusted earnings are $0.60. Tesla’s PE is 69.4 with the S&P 500 at 29. PEG ratio is negative as earnings growth is negative. Sales per share were $27.38 that’s a 9 times price to sales ratio. Book value is $19.09 better both quarterly and annually. Price to book value is 12.9 times. Tesla has $8.83 per share with the company trading at 28 times cash. The leverage ratios have debt at 0.05. Tesla did add more than $2.5 billion this quarter to its long term debt. Debt to equity was 0.08. Tesla has lots of room to borrow more if needed. Interest coverage is almost 19 times. Low debt means a good interest coverage. Liquidity ratios also look good with current at 1.9, quick 1.2 and cash 1.1.
Tesla’s return on assets is 11% and Return on equity is 18.6%. Return on capital employed is 7.8%. In Q4 2023 Tesla received a tax credit of over $5 billion distorting our return on invested capital metric. If we back it out though RIOC is 8.2%.
Tesla had an operating cash flow of $3.6 billion. An investing outflow of $3.3 billion. Financing inflow of $2.5 billion primarily from the long term debt they issued as mentioned earlier. Leaving them with a free cash flow of $15.4 billion. This is a 56 multiple to price.
Tesla doesn’t pay a dividend. The enterprise value of Tesla is $832 billion. Giving us multiple of 8.7 times revenue, 72 times EBITDA, 126 times EBIT and 55 times free cash flow. A little bit expensive we think.
Tesla Rating

The Key takeaways from the Pro side cash at $30 billion will keep the business moving forward. The other segments continue to expand diversifying earnings. Tesla has low debt and we like their ecosystem that supports the up take of electric cars in general. GM and Ford using Tesla’s supercharger network add to the long-term strength of the industry.
On the Con side we like to see better gross margins though they did improve. The market is becoming competitive at home and in China adding to margin pressures. The PE and Enterprise value ratios seem a little expensive. The US tariffs on EVs might hurt sales for Tesla in China. Lithium is difficult to extract. It requires a lot of water, takes time to yield and damages the environment.
That being said we give Tesla a neutral rating. We have no exposure to this company.
Latest News
Palo Alto Networks Beat Earnings Expectation but Cash Flow Multiples Suggest Shares are Fully Priced
Palo Alto Networks, the cybersecurity firm, reported better than expected earnings and revenue on August 19. These were adjusted earnings as the company had a large tax provision in their…
Amazon Looks Cheap After Earnings.
Amazon reported second quarter earnings on August 1st. Revenue was below what The Street was looking for but EPS did beat consensus. The market wasn’t happy despite the overall growth…
Are You Going to Buy The iPhone 16? Apple Sure Hopes You Do.
Apple’s third quarter saw lower iPhone sales but that was offset by service revenue, wearables and iPad beating revenue expectations. iPhone sales are expected to pick up with the release…
Microsoft Earnings Show Steady Scalable Growth for a $3 trillion Company
Microsoft reported Q4 and full year 2024 earnings on July 30th. Revenue and earnings per share expectations were surpassed yet the market wasn’t satisfied. Quarterly growth of 29% in Microsoft’s…
Improving Results from AMD but it’s no Nvidia.
Advanced Micro Devices reported second quarter earnings on July 30th. Revenue beat expectations of $5.7 billion on the back of its MI300X AI microchip. Even raising their second half forecasts.…


